
Stereogram Pro
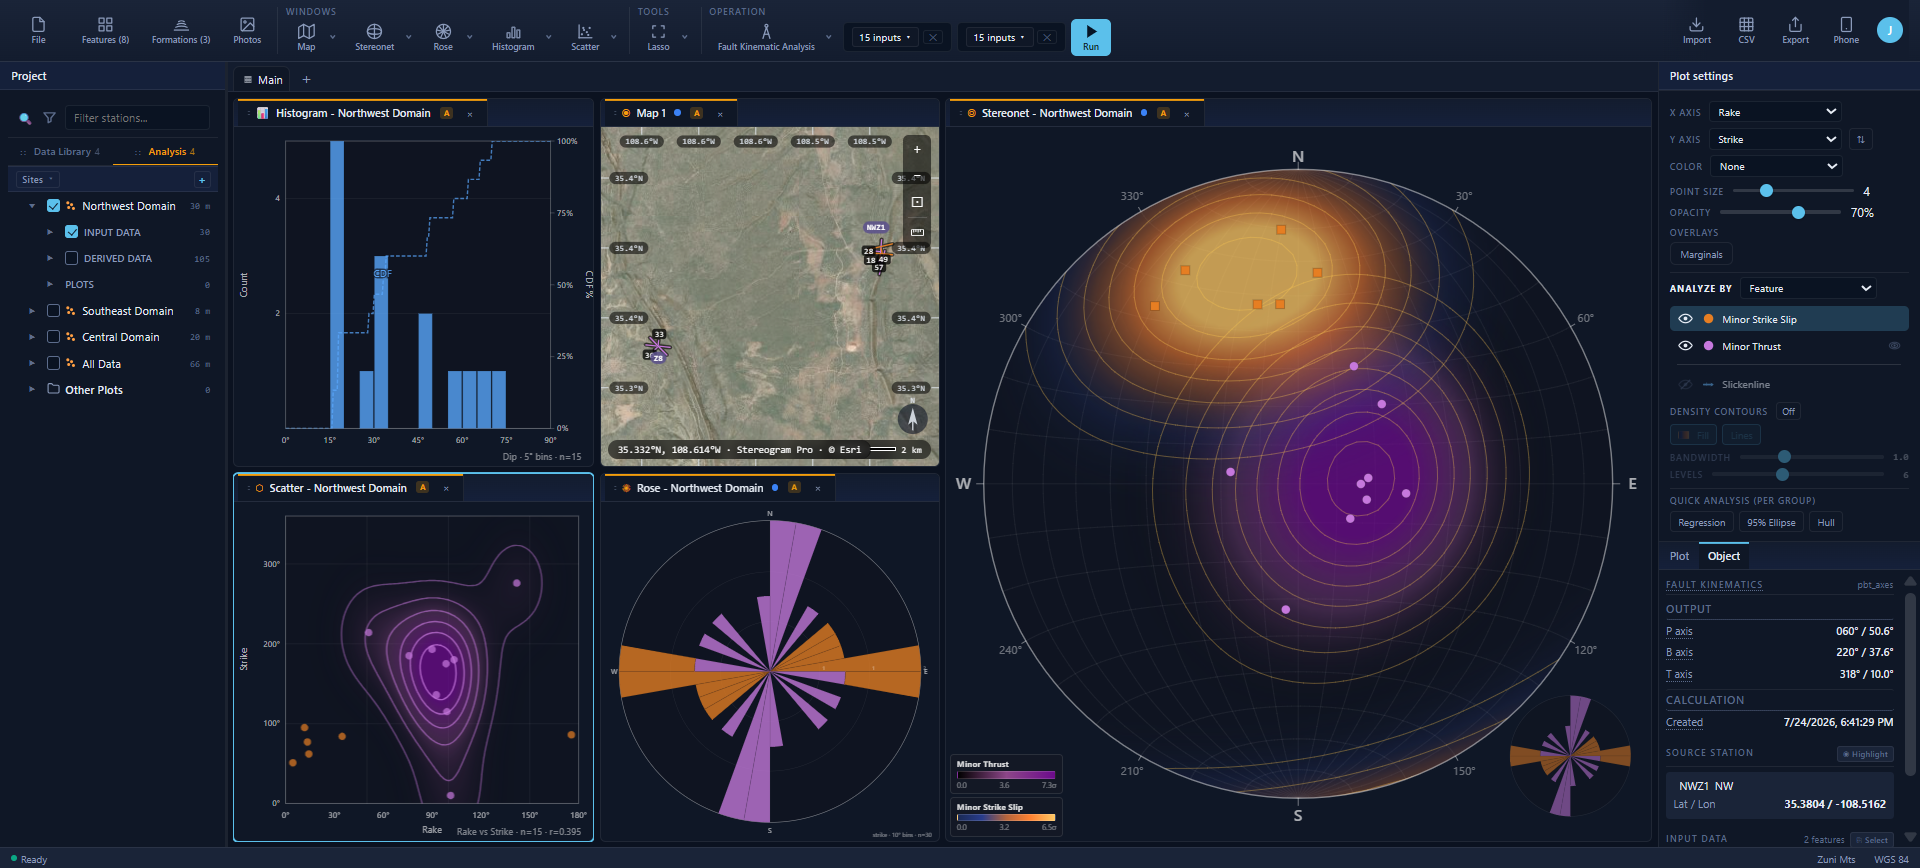
The full structural analysis platform — stereonets, density contours, rose diagrams, kinematic QC, mapping, and project management — running in your browser on Windows and macOS. Because it’s web-based, your data and analyses are available anywhere you have an internet connection. No install required, or add it to your dock or Start menu as an installable web app when you want it out of the browser.
Try it now with no signup. Open Stereogram Pro in demo mode, poke around with sample data, and never touch the cloud until you decide to make an account.
One app instead of five
Today, a structural geologist piecing together a modern workflow typically chains five separate tools: an academic stereonet program for plotting, a second tool for density analysis, a third for fault kinematic analysis, a GIS package for the map view, and a separate field-capture app for the outcrop. Stereogram replaces that stack with a single integrated platform at a fraction of the cost of even one commercial alternative.
Features & functionality
Everything you need for a full structural analysis workflow — no add-ons, no plug-ins, no chaining together separate programs.
- Equal-area stereonets on Schmidt and Wulff projections, with planes, poles, lineations, and slip arrows
- Density contouring — three Kamb methods (standard, linear, exponential) plus percent-area (Schmidt 1%)
- Rose diagrams for strike, dip-direction, and trend distributions with per-bin statistics
- Fault kinematic analysis with slip-sense, P/T-axis, and Bingham-style solutions
- Integrated map view with Esri satellite imagery and OpenTopoMap topographic basemaps, and live project sync
- Two-way sync with Stereogram Go, the free companion mobile app for field capture
- Import from CSV, GeoJSON, StraboSpot, FieldMove, and other legacy formats
- Export to PDF, PNG, SVG, CSV, and GeoJSON for reports and downstream analysis
Built for the way you actually work
Powerful structural tools are only worth having if they don’t fight you. Stereogram is designed so the software gets out of the way and the geology stays in front of you.
- Modern, dark-mode interface that’s easy on the eyes during long analysis sessions
- Runs entirely in your browser on Windows and macOS — no installers, no version conflicts; install as a PWA if you want it in your dock
- Analysis runs client-side in your browser — your data doesn’t leave your machine unless you explicitly sync it
- Sign in with email, Google, or Apple — or use anonymous demo mode with no account at all
- Access your data and analyses anywhere you have an internet connection — office, field station, hotel, laptop on a plane
- Cloud-based projects — open the same work from any machine, no file wrangling
- Automatic sync between your phone and desk — new field data appears the moment you’re online
- Keyboard shortcuts and drag-to-reorganize for common operations
- Quick QC checks that flag likely bad data before it makes it into your analysis
- Your data is yours — export any format, any time, with no lock-in
- Frequent, non-disruptive updates — features refine week by week, not once a year
See it in action
/assets/app/stereonet.gif
/assets/app/rose.gif
How Stereogram Pro compares
Web and desktop structural analysis tools currently on the market — how Stereogram stacks up against the five most commonly used alternatives. Apps A and B are the leading commercial options; Apps C, D, and E are the leading free / academic tools.
| Feature | Stereogram | App A | App B | App C | App D | App E |
|---|---|---|---|---|---|---|
| Cross-platform (Windows + macOS) | ✓ | Windows only | ✓ | ✓ | ✓ | ✓ |
| Modern, dark-mode UI | ✓ | Win-classic | ✓ | Java-era | Qt classic | Java-era |
| Equal-area stereonets (Schmidt + Wulff) | ✓ | ✓ | ✓ | ✓ | ✓ | Fault-data only |
| Kamb density contouring | 3 methods | ✓ | ✓ | ✓ | ✓ | — |
| Percent-area (1% / Schmidt) contouring | ✓ | ✓ | ✓ | ✓ | ✓ | — |
| Fault Kinematic Analysis | ✓ | ✓ | ✓ | Separate tool | — | ✓ |
| Integrated map view with project sync | ✓ | External GIS | ✓ | — | — | — |
| Direct sync with a mobile field-capture app | ✓ | — | ✓ | — | — | — |
| Export to PDF / PNG / SVG / CSV / GeoJSON | ✓ | ✓ | ✓ | PNG / EPS | PNG / SVG | PNG / EPS |
| Cost | $10 / mo or $100 / yr |
$$$ | $$$$$ | Free | Free | Free |
Apps C, D, and E are each free, but each covers only a slice of the structural workflow — you can plot in one, contour in another, analyze faults in a third, and you still don’t have the map view or the field-capture loop. Apps A and B close those gaps at commercial pricing that runs from hundreds to tens of thousands per seat per year.