What it does
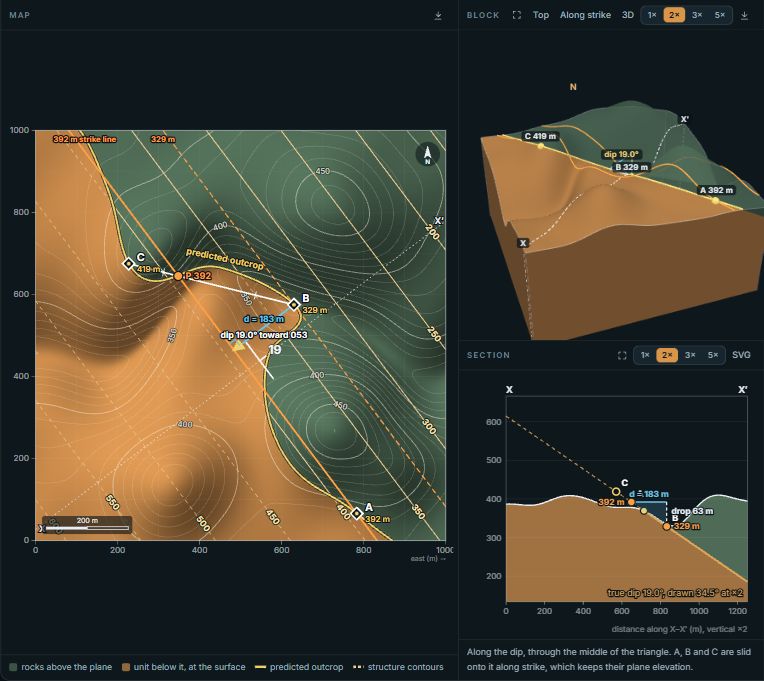
The block is 3 km on a side. Its top is a land surface you choose: a flat plain, a V-shaped valley, a ridge or a round hill. Inside it sits a stack of four to seven layers on a granite basement, all dipping at the strike and dip you set. Every face of the block, including the topographic top, is colored by the layer the rock at that point belongs to, so the contacts on the top surface are the outcrop pattern a geologic map would show.
The map beside the block is that top surface seen from above, with 50 m contours, the stream, a north arrow and a scale bar. The cross-section is cut along a line A–A′ that you drag on the map. All three come from one model of the rock, so they cannot disagree.
Things to try
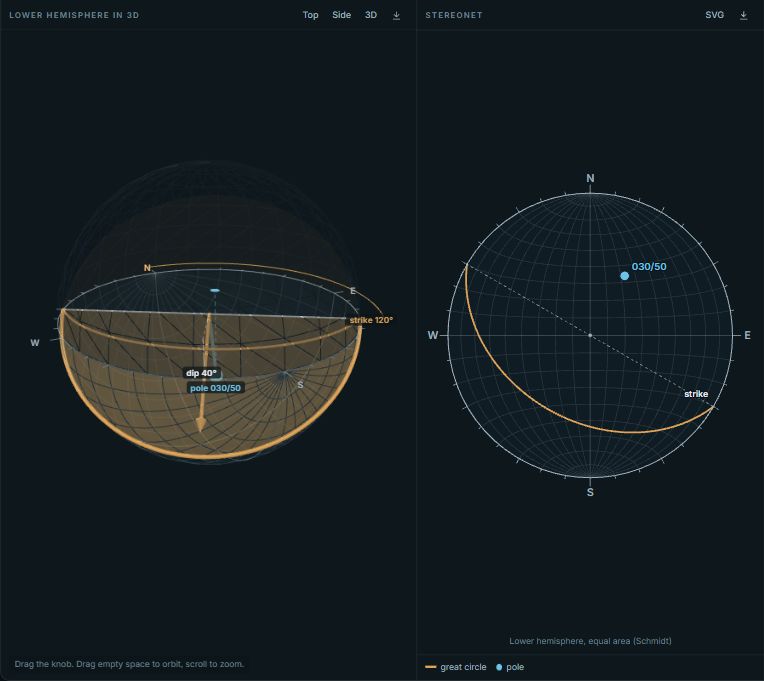
- Drag the blue knob above the block. It is the upward normal of the bedding. Tilt it and watch the contacts swing across the map. On flat ground they are straight strike lines; in a valley they bend.
- In Rule of Vs mode, step through the presets. Each keeps your valley and turns the beds: horizontal, dipping upstream, vertical, dipping downstream steeply, dipping downstream gently, and striking along the valley. The section switches to run down the valley, which is where the reason shows: compare the slope of the beds with the slope of the stream.
- Press Sweep the dip. The beds rotate about a strike line across the valley, from 70° upstream through vertical to 70° downstream and back. Watch the V shrink, straighten and flip, then flip back once the dip drops below the stream gradient.
- Turn the valley. Drag the blue arrow on the map or on the block. When the strike runs along the valley there is no V at all: each contact follows one valley wall.
- In Section mode, drag across the map to draw a new line. The block is cut along it, and the section labels the apparent dip of the bedding in that direction.
- In Fault mode, try the presets. A normal fault dipping against the beds repeats units along the section; one dipping with the beds, more steeply than they do, leaves units out. The panel lists the units you would walk across at the surface and names any that repeat or go missing.
The geometry behind the rule of Vs
Take a valley D deep whose floor falls at gradient g in the flow direction, and a bed whose apparent dip along the stream is a (positive when it dips downstream). Where a contact crosses the floor, compared with where it crosses the plain beside the valley, it has moved downstream by
A negative shift means the V points upstream. Three cases follow. If the bed dips upstream, tan a is negative and the V points upstream, but it is shorter than a contour's V. If the bed dips downstream more gently than the stream, the denominator is small and negative, so the V points upstream and reaches further up the valley than the contours. Only when a is greater than g does the V point downstream. A horizontal bed (a = 0) gives the contour's own V, which is why its contacts follow the contours. In the default block, with a 320 m deep valley, a 4° stream and beds dipping 19.7° upstream along it, a contact reaches 749 m up the valley floor, while a contour reaches more than 4.5 km, further than the block is wide.
The section's labeled angle is the apparent dip, tan a = tan d × sin β, with β the angle between the section and the strike.
Measuring the block
In Measure mode, click the top of the block or the map to take a compass reading there. Each reading is the true bedding plus scatter drawn from a Fisher distribution, set by the spread slider, so the readings look like a real outcrop survey rather than one number repeated. The scatter comes from a seeded random generator, so a copied link reproduces the same readings. The stereonet shows the poles, their Fisher mean, the 95% confidence cone (α95) and the true bedding for comparison. Add readings and α95 shrinks, while θ63, the spread of the readings themselves, stays near the value you set.
The CSV downloads with the columns ID, Type, Strike, Dip, X, Y and Elevation, and opens in Stereogram Pro as it is. For real bedding and foliation readings across the United States, the Structural Measurement Atlas maps more than 800,000 public measurements.
Using it in class
The quiz hides the block and the section and leaves only the map. One question type shows a valley and asks which way the beds dip and how steeply compared with the stream. The other grays out the valley floor, shows one contact on the plain and a strike-and-dip symbol, and asks where that contact crosses the stream; a click within 130 m counts. After each answer the block appears with the reason in words.
- Copy link saves the whole setup: bedding, layers, land surface, section line, fault and readings. A link on a slide opens exactly as you left it.
- Projector mode fills the screen. Put the block and the map side by side and ask the class to predict the V before you press a preset.
- Embed gives code for Canvas, Moodle or a course page.
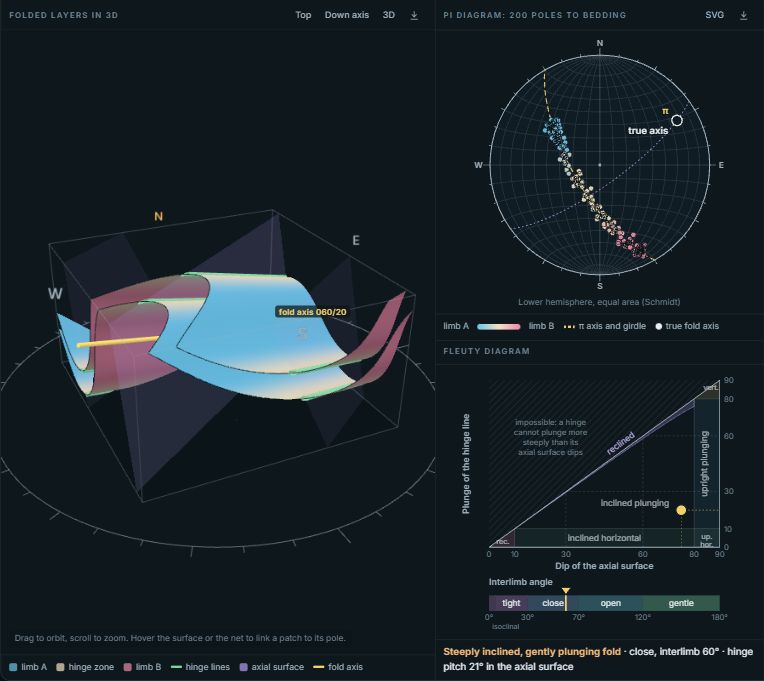
Folded layers are in the Fold Explorer, and borehole depths to one contact are the Three-Point Problem.
How the numbers are made
Each point of rock is placed by its stratigraphic height: its distance above a reference point measured along the bedding's upward normal. The contacts are fixed heights in that one number, so every face, the map and the section use the same test, and the 3D view draws the contacts in a shader rather than as separate meshes. A fault moves the hanging wall by the slip vector before that test is made; the land surface stays where it is, as though erosion had planed it after faulting. Strikes follow the right-hand rule, and strike, dip and the Fisher statistics come from the same geology code as Stereogram Pro.