What you are looking at
The left panel is a sphere cut in half. Imagine a plane passing through its center: where the plane meets the bowl it draws a curve, and the stereonet on the right is that bowl seen from above, squashed flat by a projection. The faint disc across the top of the bowl is the plane the net is drawn on. With Projected copy on the equator switched on, everything in the bowl also appears on that disc, exactly where the right-hand net puts it.
Every control moves one vector, so the 3D view, the net and the numbers can never disagree. Drag the blue knob in 3D, click anywhere on the net, or type into the sliders.
Five things to try
- Set the dip to 0°, then to 90°. A horizontal plane meets the bowl at its rim, so it plots as the primitive circle. A vertical plane plots as a straight line through the center. Every other plane is a curve between the two.
- Drag the pole around. It always sits on the far side of the net from the dip direction, and its plunge is 90° minus the dip. Watch the great circle swing as the pole moves: they are two drawings of the same plane.
- In Line mode, read trend and plunge. Trend is measured clockwise round the rim from north. Plunge is measured in from the rim, so a horizontal line sits on the rim and a vertical line in the center.
- In Cone mode, switch projections. The equal-angle net draws every small circle as a true circle. The equal-area net does not, but keeps the area inside it right.
- Press Play the projection. The bowl flattens into the net and every point travels to where the projection puts it. Press it again to lift the net back into a bowl.
Equal area or equal angle?
Both projections put the same point in the same direction from the center. They differ only in how far out it lands. For a line plunging p, at an angle θ = 90° − p from vertical:
On an equal-area net, a 1% patch of the sphere covers 1% of the net wherever it is, which is what makes Kamb and Schmidt density contours meaningful. The price is shape: circles near the rim are squashed into ovals. The equal-angle net does the opposite. Circles stay circles and angles between curves are true, but patches grow toward the rim, to exactly four times their central area at the primitive circle. Use equal area for anything you count or contour, and equal angle when you need true angles, as in crystallography.
Using it in class
Two habits make the 3D view earn its time in a lecture. First, ask students to predict before you move anything: where will the pole go if the dip doubles? Then drag. Second, leave the 3D and 2D panels side by side for the whole session, so the bowl is always visible behind the net.
- Projector mode fills the screen and enlarges the labels.
- Copy link saves the mode, the orientation and the projection. Put it on a slide and it opens exactly as you left it.
- Embed gives code for an LMS page, so students can explore before the lab.
For a first lab that uses real data, Joints in the granite of Joshua Tree gives students 109 measured joints and walks them from hand plotting to software.
How the numbers are made
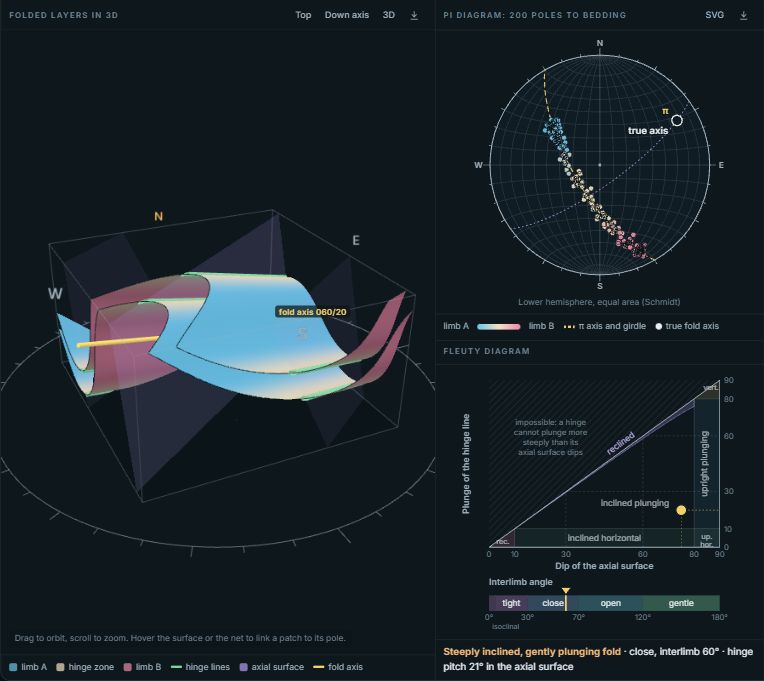
The tool runs the same geology code as Stereogram Pro. Planes use right-hand-rule strike: face along the strike and the plane dips to your right, so the dip direction is the strike plus 90°. The pole to a plane has trend equal to the dip direction minus 180° and plunge equal to 90° minus the dip. Everything is plotted on the lower hemisphere; a line that points up is plotted by its downward end.