New · free · no account · made for teaching
Geology Sandbox
A geologic model builder for the classroom. Lay down beds, then tilt, fold, fault, intrude and metamorphose them one event at a time, and read the result as a 3D block, a geologic map and a cross-section.
- Folds, faults, dikes, plutons, unconformities and metamorphic zones, each an event you can reorder or undo
- The block, the map and the section show the same model, with standard map symbols
- Weather the land and watch strong rocks stand up as hogbacks, cuestas and mesas
- Replay the history and see what each event did to the rocks
Free Teaching Tools
Interactive models for the ideas that are hardest to picture from a flat net. Built for lectures, labs and self-study.
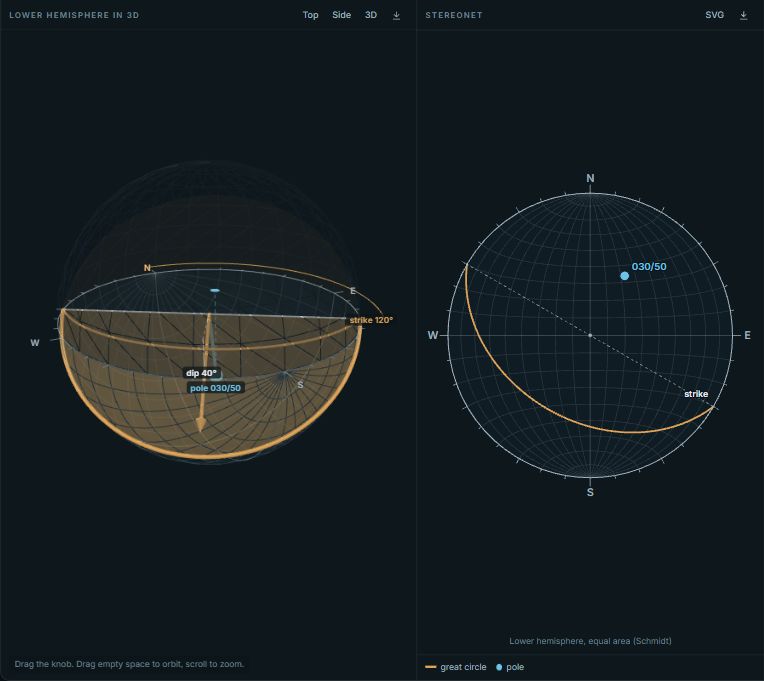
3D Stereonet
See the sphere behind the net. Drag a plane through a 3D hemisphere and watch it flatten into a great circle.
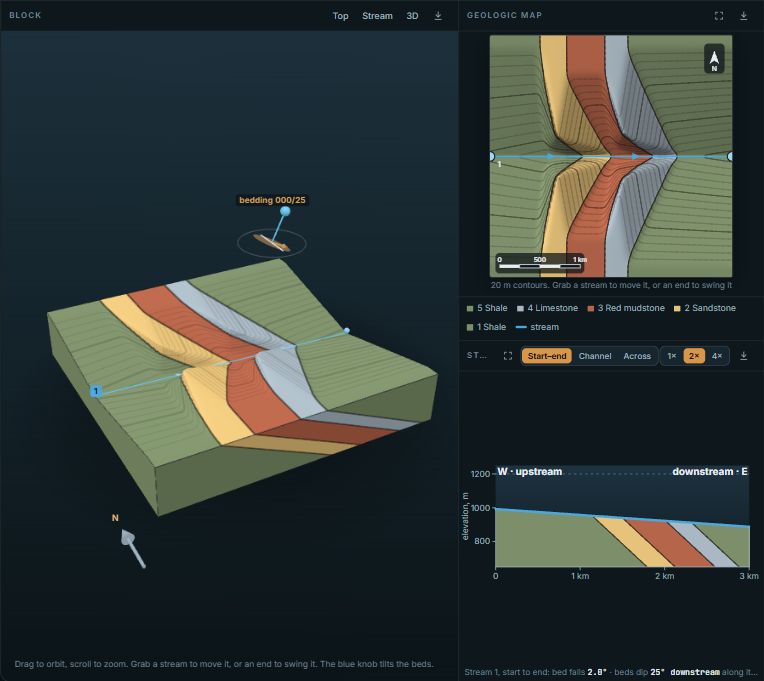
Geologic Rule of V's
Stack strong and weak rocks, fold or fault them, and run streams across the land. Watch cliffs and ridges form and see how the rule of Vs reads in them.
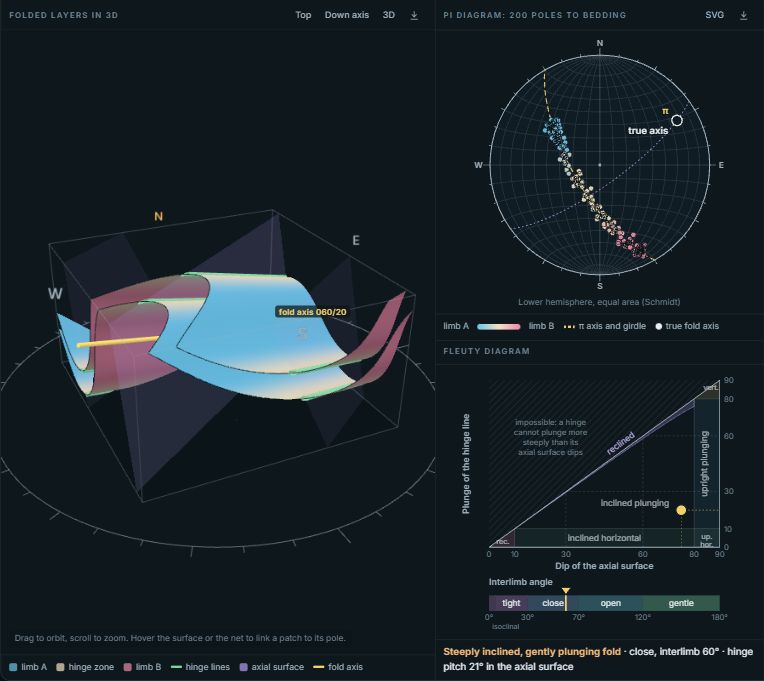
Fold Explorer
Shape a fold with sliders and see its pi diagram build as you sample bedding around the hinge.
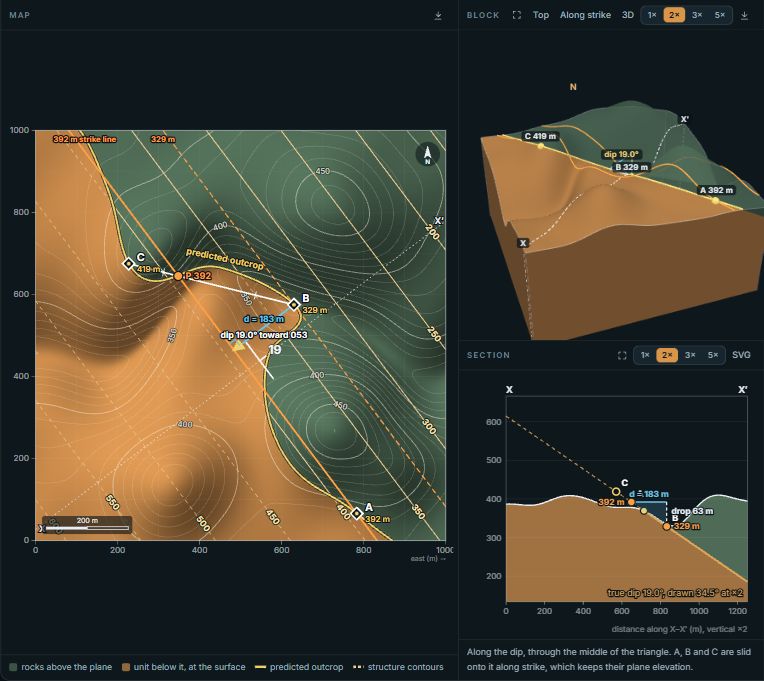
Three-Point Problem
Find the strike and dip of a plane from three outcrops or boreholes, step by step, and see where it crops out on the hills.
For instructors
The tools are built to be used in a room full of students as much as alone at a desk.
Projector mode
One button fills the screen with the tool and enlarges the labels, so the back row can read a strike and dip.
Links that keep the setup
Copy link saves the mode, the orientation and every setting. Put it on a slide or in an assignment and it opens exactly as you left it.
Embed in your course page
Each tool gives you iframe code for Canvas, Moodle, Blackboard or a course website. Students need no account.
Quizzes with feedback
Random problems, checked answers, and a sentence on the mistake behind a wrong one, such as plotting a pole toward the dip direction.
Labs with real data
Four teaching labs use published measurements from Joshua Tree, the Weissenstein, Mesa Verde and the Blythe area, with answer keys for instructors.
Tell us what you teach
Every tool has a Teaching with this? button. Tell us about the course; it decides which tools we build next, and we can set your class up with Stereogram Pro for the analysis work.
Also free: 800,000 published structural measurements
The Structural Measurement Atlas maps bedding, foliation, joint, fault and lineation readings from state surveys, USGS releases and park geology maps. Lasso an area, see its stereonet and rose diagram, and download the rows with their citations.
When it is your own data
Thousands of measurements, one workspace
The free tools show one idea at a time. Stereogram Pro puts the stereonet, rose diagram, density contours, map and data table side by side and keeps them linked, so a lasso on the map reselects the net. It opens in your browser with a demo dataset and needs no account.